In the extremely competitive manufacturing industry, it is a tough task to achieve both high quality and low costs. Budget-conscious businesses often feel like perfection is hard to achieve. Yet, there are a collection of basic but effective instruments that can lead you to a place of production bliss where errors are few, productivity is optimized, and excellence is crucial. Introduce the 7 QC Tools: an affordable option for achieving high quality without spending too much money.
7QC Tools
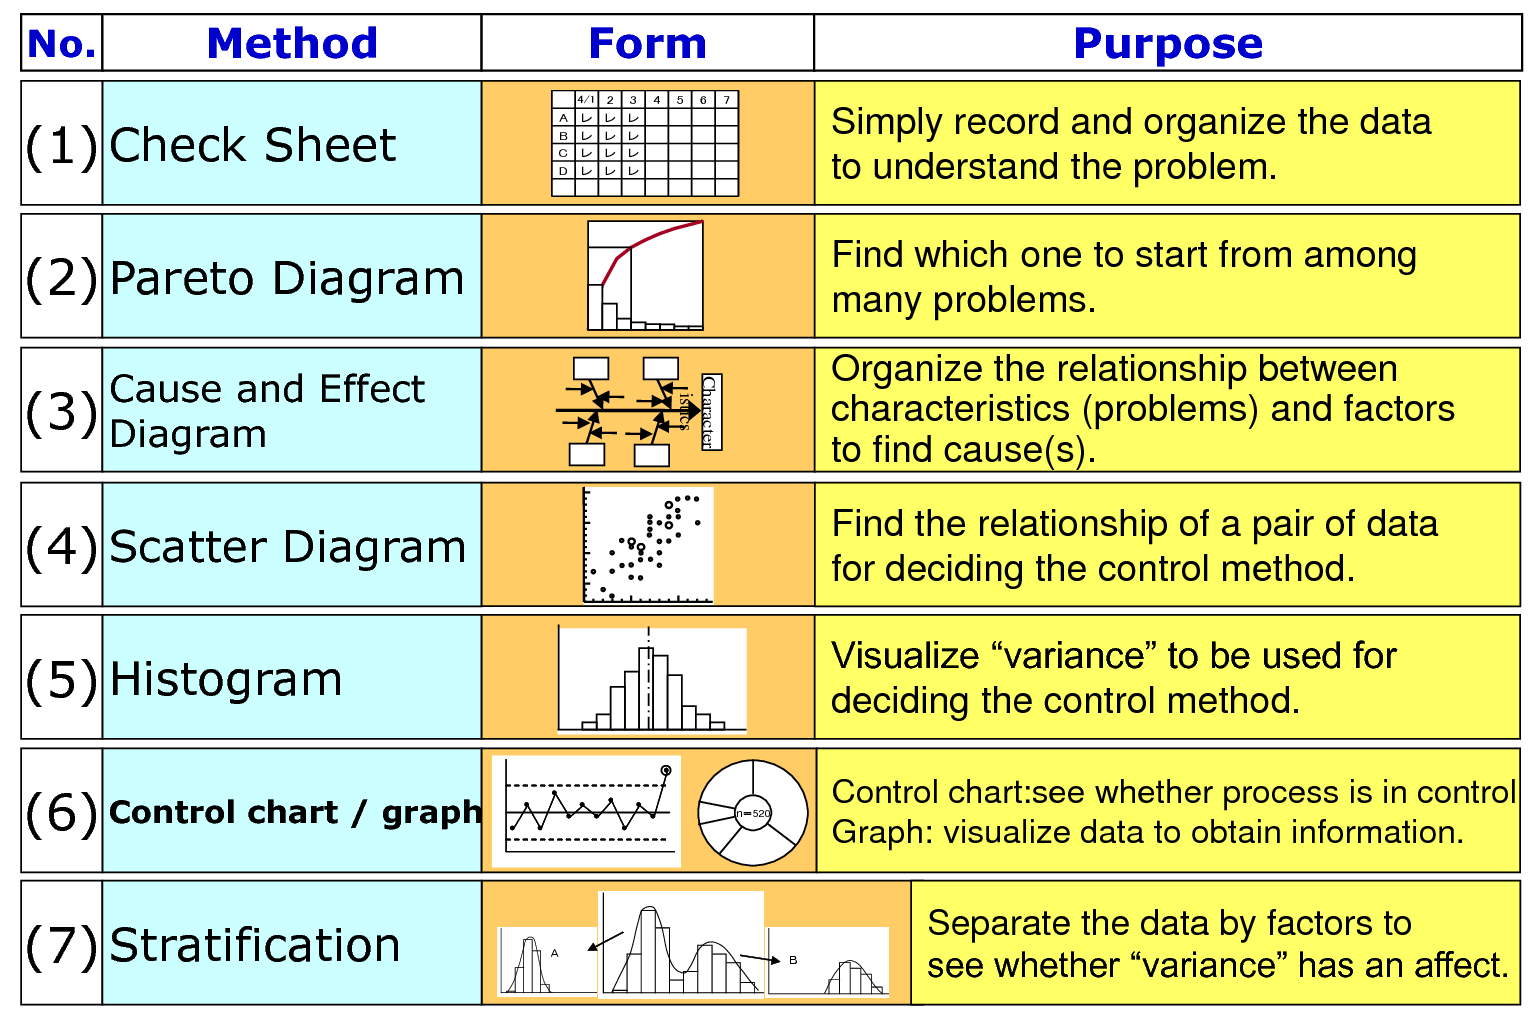
1.Cause and Effect Diagram
Also called the Ishikawa or cause-and-effect diagram, the Fishbone Diagram is a simple tool used to identify the main reasons behind quality problems. By methodically investigating possible reasons, you can discover the root causes leading to errors, enabling you to tackle them head-on and avoid future occurrences. Taking a proactive approach can help save time and resources, bringing you closer to achieving excellence. A pharmaceutical company experienced consistent problems with tablet weight inconsistency. By utilizing a Fishbone Diagram, they pinpointed root causes including variations in the quality of raw materials, levels of humidity, and calibration of equipment. By tackling these elements, they successfully decreased weight variation by 50%, resulting in improved product quality uniformity and decreased regulatory problems.
2.Check Sheet
A Check Sheet is a well-organized document used to gather and evaluate information. It is especially handy for monitoring the occurrence rate of faults or instances of particular issues. By arranging information in a transparent, easy-to-use layout, Check Sheets enable rapid examination and knowledgeable choices. This simplicity and clarity facilitate the recognition of patterns and opportunities for enhancement without any extra expenses. A Check Sheets were utilized by an electronics producer to track defects during circuit board assembly. By documenting faults during a six-month timeframe, they discovered a persistent problem with solder connections. This resulted in enhancements to the process that decreased solder joint defects by 45%, resulting in a notable enhancement in the reliability of the overall product.
3.Control Chart
Control Charts are necessary to monitor fluctuations in a process as time progresses. Differentiating between natural fluctuations and anomalies helps maintain stability and predictability in your processes. Keeping track of your processes reduces waste and improves consistency, bringing you one step closer to reaching manufacturing perfection. A food processing plant began using Control Charts to track the filling process of their packaging line. Through monitoring changes, they discovered that machine modifications were required more often than anticipated. After being dealt with, they decreased instances of both overfilling and underfilling by 30%, resulting in savings on product wastage and enhancing packaging uniformity.
4.Histogram
A histogram is a graphical representation in the form of bars that shows how data points are distributed in terms of frequency. It offers a graphical overview of differences in a procedure, aiding in comprehending the inherent spread and detecting any anomalies. Analyzing histograms allows gathering information about performance of a process and helps in making quality improvements based on data insights. A fabric defects analysis was conducted by a textile manufacturer using Histograms. The histogram indicated that a notable quantity of flaws occurred within a particular work period. Through further investigation, it was found that a specific machine operator required extra training. After receiving the training, there was a 40% reduction in defects during that shift, leading to enhanced product quality overall.
5.Pareto Chart
The 80/20 rule, also known as the Pareto Principle, states that 20% of causes account for 80% of problems. The principle is visually depicted by the Pareto Chart, assisting in discerning and prioritizing the most important concerns. By concentrating on the important few instead of the insignificant many, you can make substantial quality enhancements with little cost. A top car manufacturing company utilized pareto charts and discovered that 70% of their paint flaws stemmed from only three main reasons: dust in the paint shop, incorrect paint blend, and equipment breakdown. By concentrating on these areas, they successfully decreased paint defects by 60%, leading to an annual savings of more than $2 million.
6.Scatter Diagram
The Scatter Diagram shows numerical data pairs to discover possible relationships between variables. Analyzing two factors' relationship helps discern if changes in one factor influence the other. This comprehension can lead to changes in processes and improvements, resulting in better quality results and cost reductions. A beverage manufacturing company utilized Scatter Diagrams to investigate the correlation between the tightness of bottle caps and the rates of leakage. They discovered a significant connection, prompting them to make changes to the capping procedure. This change decreased leakages by 25%, leading to decreased product returns and enhanced customer happiness.
7.Stratification
Stratification offers a visual depiction of a procedure, outlining every step and point of decision. Mapping processes allows you to pinpoint inefficiencies, redundancies, and bottlenecks. Analyzing flowcharts to streamline processes improves efficiency, minimizes waste, and maintains consistent quality standards. A furniture producer employed Flowcharts to diagram their assembly line procedure. They discovered multiple unnecessary stages and blockages, which resulted in lateness. Through restructuring the process flow, a 20% reduction in assembly time was achieved, leading to boosted production capacity and decreased labor expenses.
Conclusion
Utilizing the 7 QC Tools involves low costs yet can bring substantial benefits in quality, productivity, and financial success. These tools enable you to be proactive in managing quality, dealing with problems at the source and making decisions backed by data. The 7 QC Tools are valuable partners in striving for manufacturing perfection, with smooth processes, few defects, and impeccable quality. They provide a cost-effective pathway to excellence, making sure that businesses with budget considerations can still attain significant quality enhancements. Embrace the potential of these no-cost tools, and convert your manufacturing procedures into a state of impeccable efficiency and quality. Here is where your path to achieving manufacturing perfection starts.